
Expect Low Returns from the S&P 500
~3% / year for the next five years (excluding dividends)
Nothing makes you second guess your investment strategy like a 30% drop in your retirement and investment accounts. As a long time value investor, I believe in ‘being greedy when others are fearful’, but this is easier said than done. It turns out March was a great time to have loaded up on the S&P 500. The problem was I didn’t have a way of knowing what the right entry point was and what returns I could expect going forward if I purchased the S&P at 2500 vs 3000, for example.
The experience made me realize I need a way to ‘value’ the stock market, so I can tell if it is objectively ‘cheap’. I want to have data and a framework I can use during times of volatility to be objective in the midst of the chaos and to make better investment decisions. To that end, I’ve gathered data on a relatively simple indicator of value - the price to earnings (P/E) ratio.
A Way to Value the Stock Market - the P/E Ratio
If you’re familiar with the P/E ratio, just skip to the next paragraph. For those that are not familiar with this, here’s a simple explanation. Imagine a company that earned $10/year which you could buy for $100. This would give the company a P/E ratio of 10. Now instead if you had to pay $200 for the same company, the P/E ratio would be 20. Quite simply, the higher the P/E ratio, the more ‘expensive’ the company.
Aswath Damodaran, who teaches valuation and corporate finance at NYU, has a data set going back to 1960, which has the total earnings for the S&P 500 companies. By dividing the price of the S&P 500 at the end of each year by the earnings, we can compute a P/E ratio for the entire S&P 500. This is what we will use to determine how expensive or cheap the US stock market is. The goal, as with all investments, is to buy low and sell high.
Companies, like people, can have unusually good or bad years. So instead of just using a single year's earnings to compute the P/E ratio, I look at the average earnings over the last five years.
What the P/E Ratio Tells Us About the Last 25 Years
Looking at this P/E ratio over the last 25 years, we see that the S&P 500 was most overvalued in 1999 during the dot com bubble (P/E ratio of 34). It was most undervalued in 2008 during the depths of the financial crises (P/E ratio of 12). If you’d bought the S&P 500 in 1999, you’d have lost 4% a year on average over the next five years. Obviously not a great investment. You would have been better off keeping the cash under a mattress. If you’d bought the S&P in 2008, you’d be up an average of 15% a year over the next five years, more than doubling your money! That would have been a great investment.
Now these two points in time were extremes, so let’s try and quantify returns during more normal years. For seven of the twenty years (between 1995 and 2014), the S&P 500 had a P/E ratio of 23 or higher. If you’d bought stocks during those times you would have made an annual return of 1% per year on average for the following five years. For eight of the twenty years , the S&P 500 had a P/E ratio of 21 or below. These were all reasonably good times to buy stocks and if you had, you would have made an average annual return of 11% a year over the next five years. Clearly there’s value in buying stocks when the P/E ratio is low.
What Does the P/E Ratio Tell Us Today
When the S&P 500 was at 2300 eight months ago, the P/E ratio was 18. That was clearly a great time to buy. I wish I’d had this historical context then! Today with the S&P around 3600, the P/E ratio is 27. If you buy stocks today, expect low returns for the next five years (my guess is annualized returns will be 2-4% a year for the next five years). All the returns discussed in this post exclude dividends.
The Math Behind the 3% Annual Return Estimate
So, how did I arrive at a 2-4% annualized return?
To start with, we need to estimate earnings for the S&P over the next five years. The S&P 500 is composed of companies from different industries. Tech is by far the biggest sector in the S&P 500 with a 23% weighting. Materials, Utilities and Real Estate are the smallest sectors at 3% each. Clearly COVID had a very different impact on each of these sectors. The table below shows my guess for how I think each of these sectors will be impacted in 2020 and 2021.
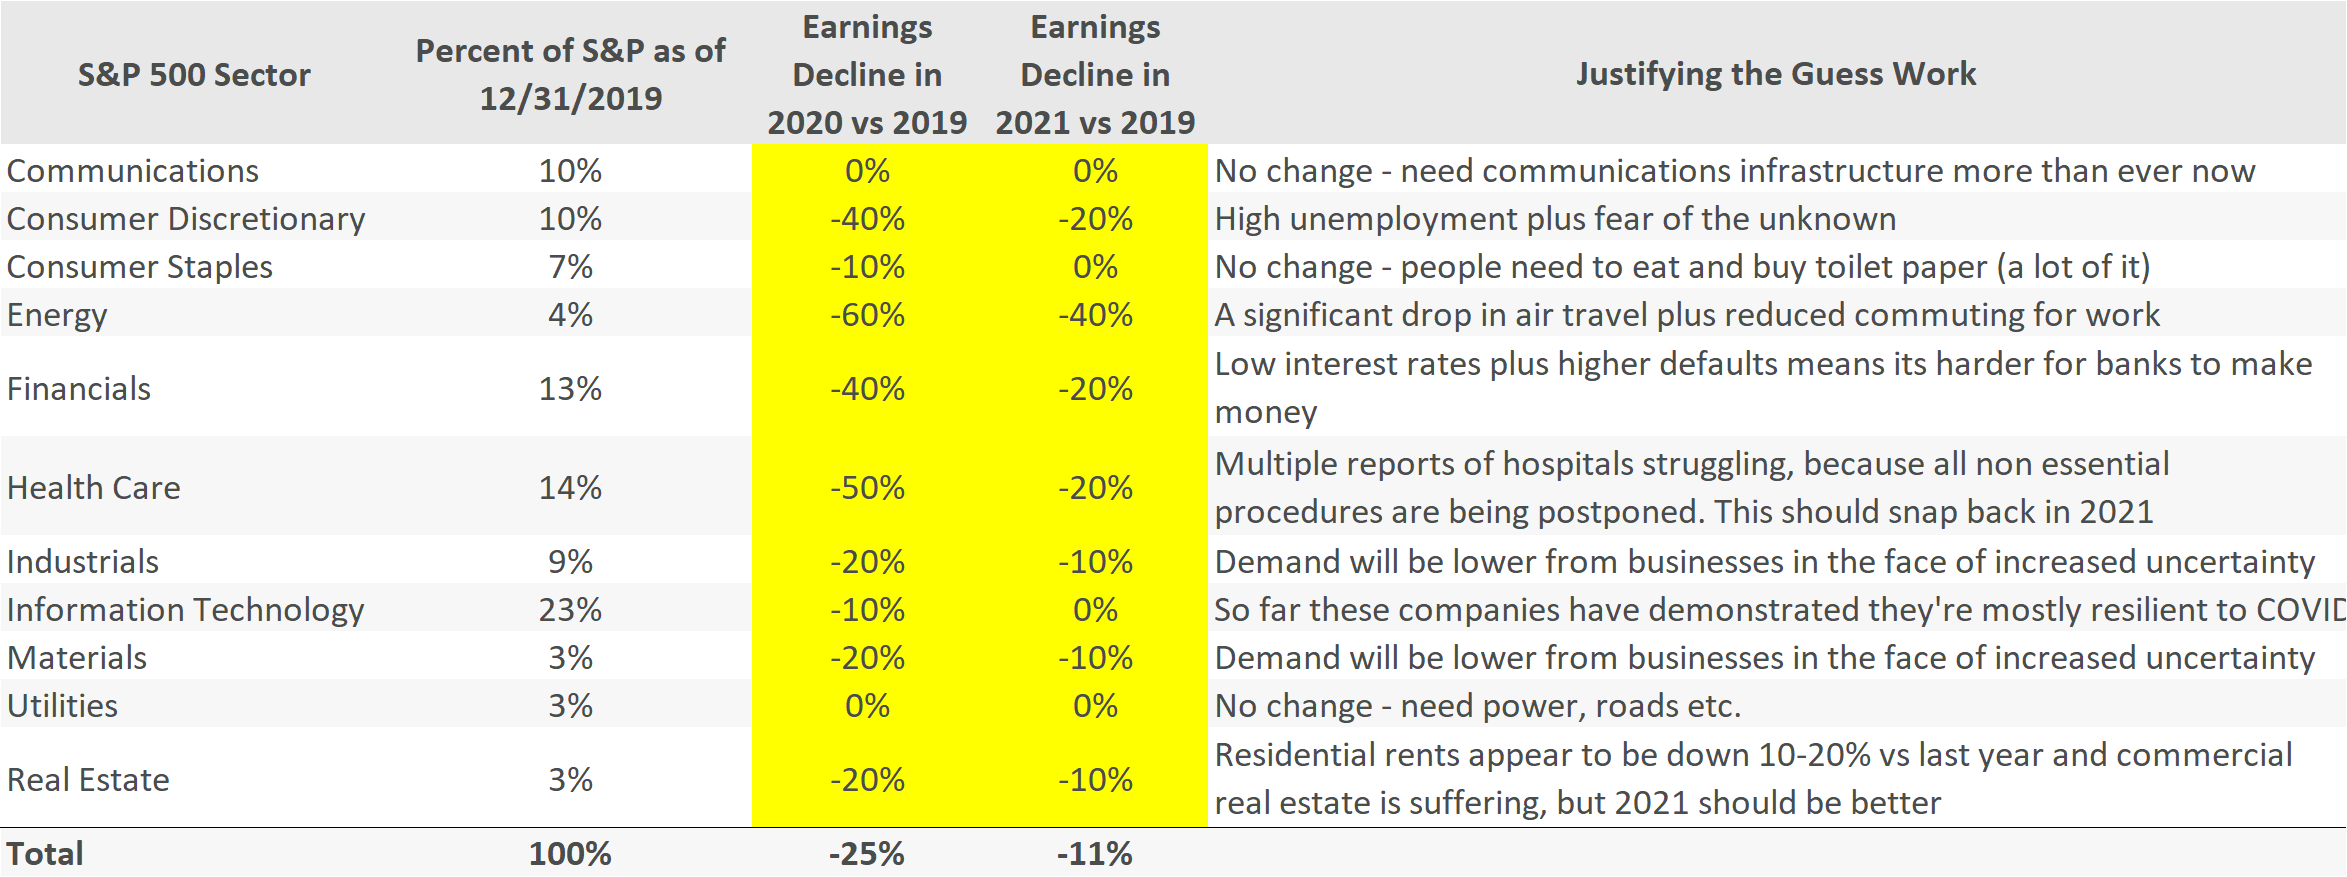
In 2022, I’m guessing earnings will rebound (up 20% vs 2021) before returning to growth of 6% a year on average. The reason I use 6% vs the 8% average of the last 19 years is because interest rates have been moving steadily lower over the last 19 years, which has helped corporate earnings. Without this assistance, I’m guessing earnings growth will be lower. My earnings forecasts are summarized below.
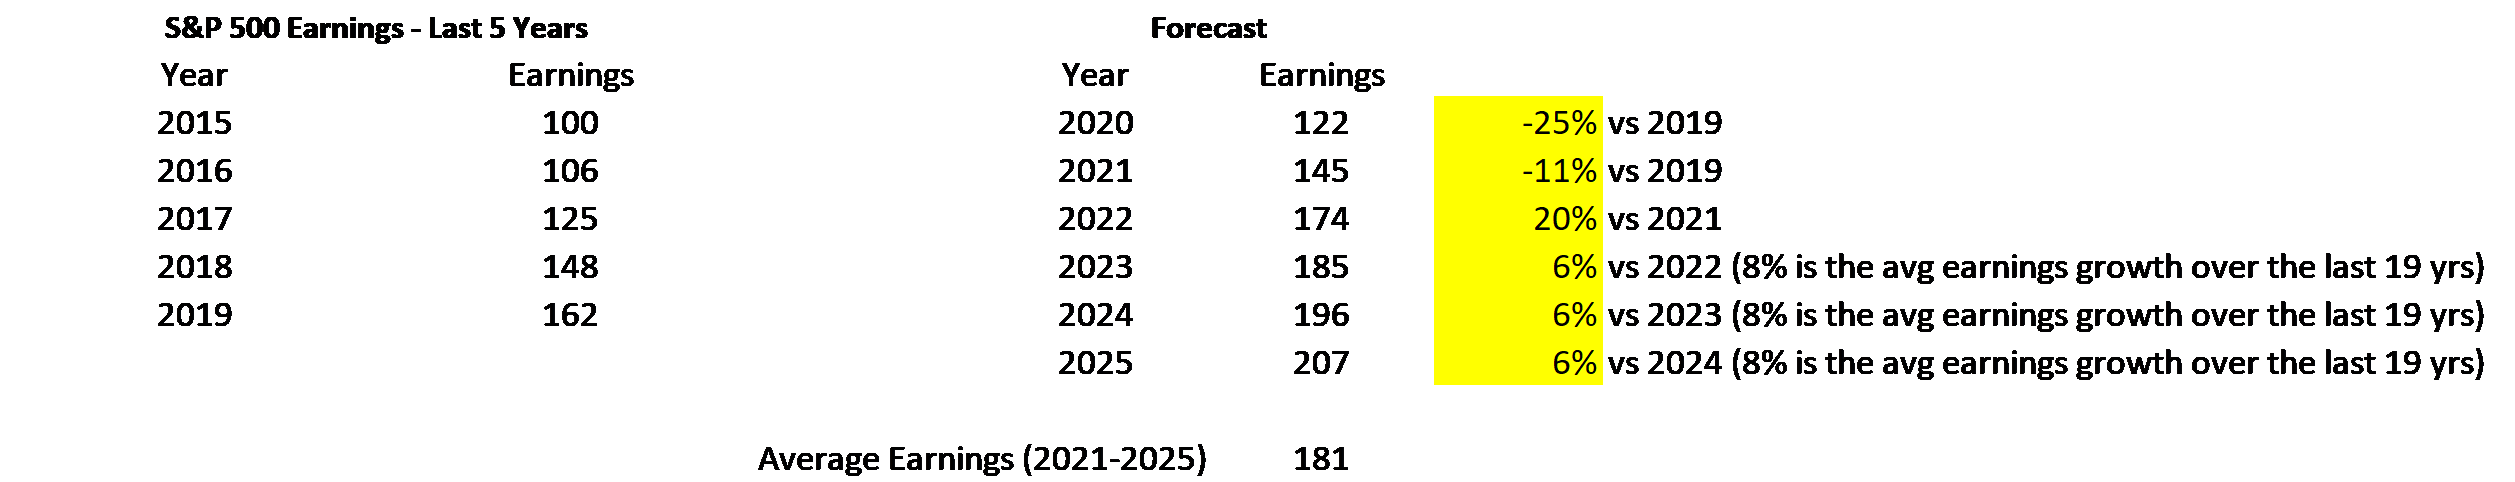
Now that I have a guess for average S&P earnings over the next 5 years, I can apply a P/E multiple to these earnings, to get a value for the S&P 500 at year end 2025. It's impossible to know what P/E multiple the S&P will be trading at in 5 years, so I will just use the median multiple since 2000, which is 21. Using this, the S&P would be at ~3900 by year end 2025. Given the S&P is at 3600 today, this equates to a 2% annual return for the next five years. If we continue in this low rate environment, there’s a good chance the P/E multiple will be closer to 24 - this implies an S&P 500 value of 4355 in 2025 and a 4% annualized return.
Buy or Wait? I’m Going to Wait
Clearly there is a lot of guesswork involved here, so take these numbers with a grain of salt. For stocks to be compelling, I’d like to see returns (excluding dividends) of closer to 5%. Rental properties can give you returns of 4% and have less volatility than stocks, so at these levels for the S&P, you might be better off putting your money in real estate.
Try the Model for Yourself
If you’re like me and like to be able to play with the model, you can download it here. Please put in your assumptions for earnings over the next 5 years and the P/E multiple you think is appropriate for 2025. I’d love to hear where you think the S&P will be in five years - please post in the comments below!